NFL
Week 3 is the 0-2 tipping point — here is what the number actually says
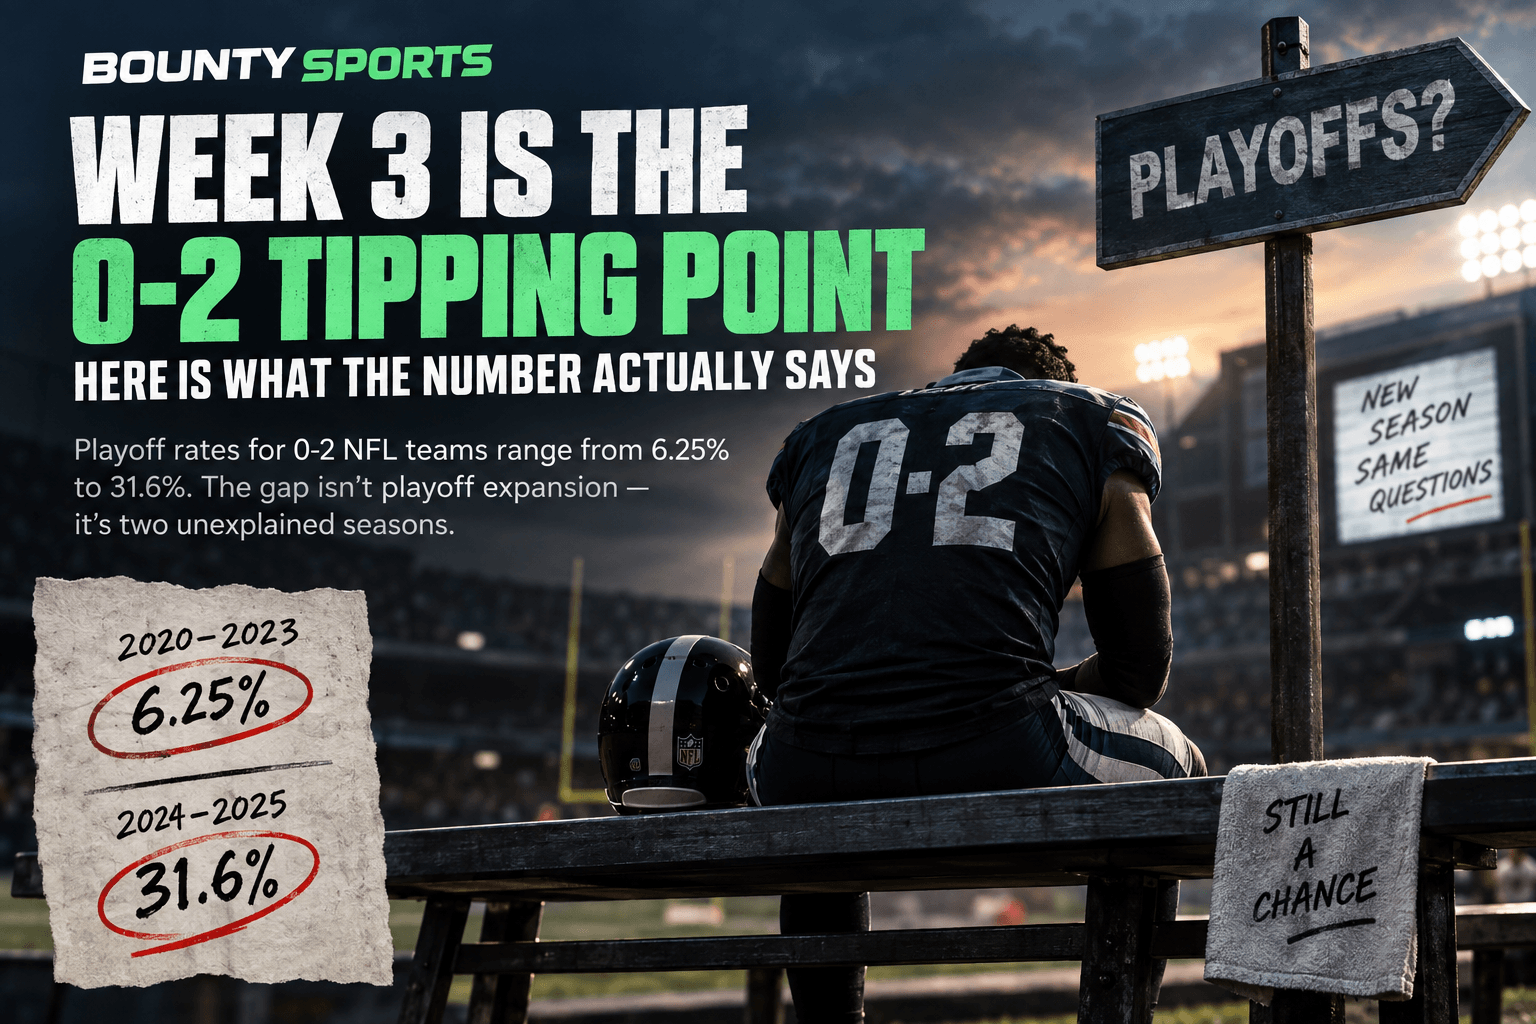
How often does an 0-2 NFL team make the playoffs? Depending on which number you find, somewhere between 6.25% and 31.6%. Useful. Both numbers come from real samples. Neither is necessarily wrong. They’re counting different seasons. Eight teams enter Week 3 at 0-2, so the usual statistic is doing the rounds again. The usual explanation ... Week 3 is the 0-2 tipping point — here is what the number actually says
How often does an 0-2 NFL team make the playoffs?
Depending on which number you find, somewhere between 6.25% and 31.6%.
Useful.
Both numbers come from real samples. Neither is necessarily wrong.
They’re counting different seasons.
Eight teams enter Week 3 at 0-2, so the usual statistic is doing the rounds again. The usual explanation for the disagreement goes like this: the NFL expanded the playoffs to 14 teams in 2020, therefore older numbers make modern 0-2 teams look worse than they really are.
The data doesn’t cooperate.
From 2020 through 2023, only 2 of 32 0-2 teams made the playoffs.
That’s 6.25%.
Then 2024 and 2025 happened.
Six of 19 made it.
That’s 31.6%.
The playoff field didn’t suddenly expand again in 2024.
So whatever changed, blaming the 14-team format doesn’t explain it.
And with 19 team-seasons in the high-rate sample, I am not going to pretend I know what does.
How often do 0-2 teams make the playoffs?
The long-run answer is roughly 10% to 12%.
The last two seasons say 31.6%.
The first four seasons of the expanded playoff field work out to 6.25%.
There is no single correct number without a date range attached to it.
Here are the figures I could source.
| Rate | Sample and window | Source | Date |
|---|---|---|---|
| 6.25% (2 of 32) | 0-2 teams, 2020–2023. Denominator derived below | Yahoo Sports; cross-check with Opta Analyst | 21 Sept 2026 |
| ~10% (of 451) | 0-2 teams since 1966 | Opta Analyst | 17 Sept 2025 |
| 9.9% | 0-2 teams, 2002–2023 | Yahoo Sports | 21 Sept 2026 |
| 10.5% (46 of 436) | 0-2 teams since the 1970 merger; published endpoint unclear | Yahoo Sports | 16 Sept 2025 dateline, later content |
| 11.5% (32 of 279) | 0-2 teams, 1990–2023 | Sports Illustrated | 19 Sept 2024 |
| 12.0% (24 of 200) | 0-2 teams, 2002–2025 | Yahoo Sports | 21 Sept 2026 |
| 12.2% (5 of 41) | 0-2 teams, 2020–2024 | Opta Analyst | 17 Sept 2025 |
| 31.6% (6 of 19) | 0-2 teams, 2024–2025 | Yahoo Sports | 21 Sept 2026 |
| 29% | Circulating Reddit claim with no published method or sample | Reddit r/nfl | Undated |
| 43.75% (14 of 32) | Share of all teams reaching the current playoff field | Arithmetic | Current format |
| 62% (124 of 200) | 2-0 teams, 2002–2025 | Yahoo Sports | 21 Sept 2026 |
| 42% (152 of 360) | 1-1 teams, 2002–2025 | Yahoo Sports | 21 Sept 2026 |
Sources accessed 22 September 2026: Yahoo Sports, Opta Analyst, Sports Illustrated, and Yahoo Sports. The Reddit number is included because people will find it. It is not evidence.
One correction before we go any further.
You cannot compare that 42% figure for 1-1 teams directly with today’s 43.75% playoff rate and call them equivalent eras.
The 2002–2025 sample contains 18 seasons with 12 playoff spots and six with 14.
Weight the league-wide baseline accordingly and you get roughly 39.1%.
So 1-1 teams in that sample performed slightly better than the average team from their own era.
0-2 teams were nowhere close.
That is the cliff.
Why are the published numbers so different?
The tempting answer is playoff expansion.
It is also the weak answer.
Look at the supposedly modern era.
Opta gives us 5 of 41 for 2020–2024.
Sports Illustrated identifies nine 0-2 teams in 2024. Yahoo identifies the three that recovered: Baltimore, the Rams and Denver.
Subtract them.
5 − 3 = 2.
41 − 9 = 32.
That gives us 2 of 32 from 2020–2023: 6.25%.
Yahoo independently says only two 0-2 teams made the playoffs over those four seasons.
So the numerator is supported by two sources.
The denominator is my derivation.
That distinction matters.
It also means the first four years of the expanded format did not produce some obvious rescue effect for 0-2 teams. Quite the opposite.
Then the last two seasons went the other way.
2024: 3 of 9.
2025: 3 of 10.
Combined: 6 of 19, or 31.6%.
That’s why recent windows suddenly look generous.
Not because the format changed in 2024.
Because the results did.
Is that a new trend?
I don’t know.
Nineteen team-seasons is not enough for me to call it one.
Against a long-run playoff rate of around 12%, you’d expect roughly 2.3 qualifiers from 19 0-2 teams.
We got six.
Interesting.
But interesting and stable are not synonyms.
The same caution applies at the other end. Two playoff teams from 32 looks terrible, but against that same 12% baseline you’d expect about 3.8.
Two or fewer is not some statistical miracle.
So I am not claiming 2020–2023 proved the expanded format made life harder.
It didn’t.
I’m saying there is no evidence in those first four seasons that expansion suddenly made 0-2 starts easier to survive.
That’s a much smaller claim.
It is also the one the data can actually support.
Which number should we use today?
Somewhere between roughly 11% and 32%.
Unsatisfying?
Yes.
Still better than false precision.
The long run says about 11%.
The last two seasons say 31.6%.
I do not have a principled reason to choose one and pretend it describes 2026 perfectly.
And averaging them would just create a number belonging to no actual era.
The derived 6.25% stays out of that range on purpose. Four seasons is a small sample, and the denominator is mine rather than directly published.
Use it to understand the argument.
Do not build a forecast on it.
The base rate is not your team’s probability
Eight teams are 0-2 entering Week 3: Atlanta, Houston, Indianapolis, the Los Angeles Chargers, Miami, Tampa Bay, Tennessee and Washington.
Same record.
Very different situations.
Take Houston and the Chargers.
Houston lost 36-31 to Buffalo and 20-6 to Cincinnati.
Point differential: -19.
The Chargers lost 26-14 to Arizona and 26-14 to Las Vegas.
Point differential: -24.
Five points apart.
On the scorelines alone, not much separates them.
Now look at the divisions.
The AFC South is 1-7 combined.
Jacksonville are 1-1. Houston, Indianapolis and Tennessee are all 0-2.
Somebody wins that division.
The AFC West is 5-3.
Kansas City and Las Vegas are 2-0. Denver are 1-1. The Chargers are last.
Same 0-2 record.
Completely different route to January.
A historical base rate across hundreds of teams doesn’t know what division you’re in.
That isn’t a flaw in the statistic.
It’s a limit on what the statistic can answer.
What does the market think?
Houston to make the playoffs: -122.
Chargers: +265.
Both FanDuel prices were published by FOX Sports on a page stamped 21 September 2026, 9:52 a.m. ET. I checked again on the 22nd and the page had not updated, so treat these as the latest published prices I have, not live ones.
Now the conversion.
Houston -122:
122 ÷ 222 = 55.0%.
Chargers +265:
100 ÷ 365 = 27.4%.
Both are pre-vig.
I cannot remove the vig properly without the matching “miss the playoffs” prices from FanDuel at the same moment.
So 55% is not my estimate of Houston’s real probability.
It is the probability embedded in one side of the bookmaker’s price.
Important difference.
Houston: 55% versus a base rate below 32%
Now we have something worth discussing.
Long run: roughly 11%.
Best recent two-year window: 31.6%.
Houston market price: 55% before vig.
Looks ridiculous.
Until you ask what the market is actually pricing.
Houston are 0-2 in a division where no team has more than one win.
The AFC South champion gets a playoff berth regardless of what usually happens to an 0-2 team.
So FanDuel is not simply asking:
How often do 0-2 teams recover?
It is asking:
How often does Houston win this particular division from here?
Different problem.
And the historical 0-2 table does not answer it.
There is another wrinkle.
Houston are part of the recent recovery sample themselves.
They started 0-2 last season.
They still made the playoffs.
The market has seen this roster do exactly what the base rate calls unusual.
And Week 3 tells us something else about how Houston are being rated: they are 2.5-point road favourites at Indianapolis.
An 0-2 team favoured away from home is not being priced like an ordinary 0-2 team.
Narrative noted.
Receipt supplied.
What could break this analysis?
Plenty.
First: sample size.
The headline modern samples are 19 team-seasons and 32 team-seasons.
That is not much.
Second: the 6.25% denominator is derived rather than directly published.
The inputs are sourced. The subtraction is mine.
Third: the population of teams that starts 0-2 may itself be changing.
The NFL moved to a 17-game regular season in 2021.
It is plausible that scheduling, opponent strength or other structural changes affect which teams end up 0-2.
Plausible is not enough.
I do not have evidence strong enough to quantify it, so it stays outside the model.
And finally: Houston’s playoff price has 15 games left to resolve.
That is a lot of football.
An injury, a quarterback change or one divisional upset can move this market far more than another historical percentage point.
The price
So where does that leave Houston at -122?
The historical base rate says somewhere around 11% to 32%.
The market says 55% pre-vig.
That looks like at least a 23-point gap.
I do not think it is an edge.
I think it is evidence that the two numbers are measuring different things.
The base rate measures what happens to 0-2 teams across the league.
Houston’s price depends heavily on whether the AFC South is as weak as it currently looks and whether Houston are the best of four flawed teams.
Two weeks is not enough for me to price that precisely.
So I won’t.
THE LEDGER
Market: Houston Texans to make the 2026 playoffs
Price: -122, FanDuel via FOX Sports
Model probability: No point estimate
Market probability: 55.0% pre-vig
Ledger edge: Not calculable
Fair odds: Not enough information
Confidence: Low
Verdict: PASS
If the price drifts beyond +120, I look again.
If it shortens through -160, I look at the other side.
Same team.
Different bet.
And if you remember one thing from all of this, make it this:
There is no honest answer to “how often do 0-2 teams make the playoffs?” without a date range attached.
Anyone giving you one decimal place without telling you which seasons they counted is selling confidence, not probability.
21+ where applicable — check the legal age in your state. Betting is entertainment. A season-long playoff market is not an investment and is not a way to chase losses. If gambling is causing you or someone you know harm, the National Problem Gambling Helpline is free and confidential: call or text 1-800-MY-RESET (1-800-697-3738), or visit 1800myreset.org. 1-800-GAMBLER also remains active through the Council on Compulsive Gambling of New Jersey, and 1-800-522-4700 remains in service.
Disclosure: Bounty Sports may earn a commission from sportsbooks named on this page. It does not change which numbers we quote or which side we argue.

""
22 Sep 2026
Related

NFL
The Bills Have Run Out of Acceptable Excuses
Buffalo changed the coach, upgraded Josh Allen's receiving options and invested in…

Bounty Sports
11 Aug 2026

NFL
NFL Week 3 opening lines: three numbers I think are wrong
Green Bay are better than Atlanta. Buffalo are better than the Chargers.…
Bounty Sports
21 Sep 2026

NFL
The NFL’s Quarterback Middle Class Is Becoming Financially Unsustainable
The league can afford almost any contract under a rising salary cap.…
Bounty Sports
6 Aug 2026
Subscribe
By subscribing you agree to with our
Privacy Policy© 2026 Bounty Sports. All rights reserved.
NFL
Week 3 is the 0-2 tipping point — here is what the number actually says
How often does an 0-2 NFL team make the playoffs? Depending on which number you find, somewhere between 6.25% and 31.6%. Useful. Both numbers come from real samples. Neither is necessarily wrong. They’re counting different seasons. Eight teams enter Week 3 at 0-2, so the usual statistic is doing the rounds again. The usual explanation ... Week 3 is the 0-2 tipping point — here is what the number actually says
How often does an 0-2 NFL team make the playoffs?
Depending on which number you find, somewhere between 6.25% and 31.6%.
Useful.
Both numbers come from real samples. Neither is necessarily wrong.
They’re counting different seasons.
Eight teams enter Week 3 at 0-2, so the usual statistic is doing the rounds again. The usual explanation for the disagreement goes like this: the NFL expanded the playoffs to 14 teams in 2020, therefore older numbers make modern 0-2 teams look worse than they really are.
The data doesn’t cooperate.
From 2020 through 2023, only 2 of 32 0-2 teams made the playoffs.
That’s 6.25%.
Then 2024 and 2025 happened.
Six of 19 made it.
That’s 31.6%.
The playoff field didn’t suddenly expand again in 2024.
So whatever changed, blaming the 14-team format doesn’t explain it.
And with 19 team-seasons in the high-rate sample, I am not going to pretend I know what does.
How often do 0-2 teams make the playoffs?
The long-run answer is roughly 10% to 12%.
The last two seasons say 31.6%.
The first four seasons of the expanded playoff field work out to 6.25%.
There is no single correct number without a date range attached to it.
Here are the figures I could source.
| Rate | Sample and window | Source | Date |
|---|---|---|---|
| 6.25% (2 of 32) | 0-2 teams, 2020–2023. Denominator derived below | Yahoo Sports; cross-check with Opta Analyst | 21 Sept 2026 |
| ~10% (of 451) | 0-2 teams since 1966 | Opta Analyst | 17 Sept 2025 |
| 9.9% | 0-2 teams, 2002–2023 | Yahoo Sports | 21 Sept 2026 |
| 10.5% (46 of 436) | 0-2 teams since the 1970 merger; published endpoint unclear | Yahoo Sports | 16 Sept 2025 dateline, later content |
| 11.5% (32 of 279) | 0-2 teams, 1990–2023 | Sports Illustrated | 19 Sept 2024 |
| 12.0% (24 of 200) | 0-2 teams, 2002–2025 | Yahoo Sports | 21 Sept 2026 |
| 12.2% (5 of 41) | 0-2 teams, 2020–2024 | Opta Analyst | 17 Sept 2025 |
| 31.6% (6 of 19) | 0-2 teams, 2024–2025 | Yahoo Sports | 21 Sept 2026 |
| 29% | Circulating Reddit claim with no published method or sample | Reddit r/nfl | Undated |
| 43.75% (14 of 32) | Share of all teams reaching the current playoff field | Arithmetic | Current format |
| 62% (124 of 200) | 2-0 teams, 2002–2025 | Yahoo Sports | 21 Sept 2026 |
| 42% (152 of 360) | 1-1 teams, 2002–2025 | Yahoo Sports | 21 Sept 2026 |
Sources accessed 22 September 2026: Yahoo Sports, Opta Analyst, Sports Illustrated, and Yahoo Sports. The Reddit number is included because people will find it. It is not evidence.
One correction before we go any further.
You cannot compare that 42% figure for 1-1 teams directly with today’s 43.75% playoff rate and call them equivalent eras.
The 2002–2025 sample contains 18 seasons with 12 playoff spots and six with 14.
Weight the league-wide baseline accordingly and you get roughly 39.1%.
So 1-1 teams in that sample performed slightly better than the average team from their own era.
0-2 teams were nowhere close.
That is the cliff.
Why are the published numbers so different?
The tempting answer is playoff expansion.
It is also the weak answer.
Look at the supposedly modern era.
Opta gives us 5 of 41 for 2020–2024.
Sports Illustrated identifies nine 0-2 teams in 2024. Yahoo identifies the three that recovered: Baltimore, the Rams and Denver.
Subtract them.
5 − 3 = 2.
41 − 9 = 32.
That gives us 2 of 32 from 2020–2023: 6.25%.
Yahoo independently says only two 0-2 teams made the playoffs over those four seasons.
So the numerator is supported by two sources.
The denominator is my derivation.
That distinction matters.
It also means the first four years of the expanded format did not produce some obvious rescue effect for 0-2 teams. Quite the opposite.
Then the last two seasons went the other way.
2024: 3 of 9.
2025: 3 of 10.
Combined: 6 of 19, or 31.6%.
That’s why recent windows suddenly look generous.
Not because the format changed in 2024.
Because the results did.
Is that a new trend?
I don’t know.
Nineteen team-seasons is not enough for me to call it one.
Against a long-run playoff rate of around 12%, you’d expect roughly 2.3 qualifiers from 19 0-2 teams.
We got six.
Interesting.
But interesting and stable are not synonyms.
The same caution applies at the other end. Two playoff teams from 32 looks terrible, but against that same 12% baseline you’d expect about 3.8.
Two or fewer is not some statistical miracle.
So I am not claiming 2020–2023 proved the expanded format made life harder.
It didn’t.
I’m saying there is no evidence in those first four seasons that expansion suddenly made 0-2 starts easier to survive.
That’s a much smaller claim.
It is also the one the data can actually support.
Which number should we use today?
Somewhere between roughly 11% and 32%.
Unsatisfying?
Yes.
Still better than false precision.
The long run says about 11%.
The last two seasons say 31.6%.
I do not have a principled reason to choose one and pretend it describes 2026 perfectly.
And averaging them would just create a number belonging to no actual era.
The derived 6.25% stays out of that range on purpose. Four seasons is a small sample, and the denominator is mine rather than directly published.
Use it to understand the argument.
Do not build a forecast on it.
The base rate is not your team’s probability
Eight teams are 0-2 entering Week 3: Atlanta, Houston, Indianapolis, the Los Angeles Chargers, Miami, Tampa Bay, Tennessee and Washington.
Same record.
Very different situations.
Take Houston and the Chargers.
Houston lost 36-31 to Buffalo and 20-6 to Cincinnati.
Point differential: -19.
The Chargers lost 26-14 to Arizona and 26-14 to Las Vegas.
Point differential: -24.
Five points apart.
On the scorelines alone, not much separates them.
Now look at the divisions.
The AFC South is 1-7 combined.
Jacksonville are 1-1. Houston, Indianapolis and Tennessee are all 0-2.
Somebody wins that division.
The AFC West is 5-3.
Kansas City and Las Vegas are 2-0. Denver are 1-1. The Chargers are last.
Same 0-2 record.
Completely different route to January.
A historical base rate across hundreds of teams doesn’t know what division you’re in.
That isn’t a flaw in the statistic.
It’s a limit on what the statistic can answer.
What does the market think?
Houston to make the playoffs: -122.
Chargers: +265.
Both FanDuel prices were published by FOX Sports on a page stamped 21 September 2026, 9:52 a.m. ET. I checked again on the 22nd and the page had not updated, so treat these as the latest published prices I have, not live ones.
Now the conversion.
Houston -122:
122 ÷ 222 = 55.0%.
Chargers +265:
100 ÷ 365 = 27.4%.
Both are pre-vig.
I cannot remove the vig properly without the matching “miss the playoffs” prices from FanDuel at the same moment.
So 55% is not my estimate of Houston’s real probability.
It is the probability embedded in one side of the bookmaker’s price.
Important difference.
Houston: 55% versus a base rate below 32%
Now we have something worth discussing.
Long run: roughly 11%.
Best recent two-year window: 31.6%.
Houston market price: 55% before vig.
Looks ridiculous.
Until you ask what the market is actually pricing.
Houston are 0-2 in a division where no team has more than one win.
The AFC South champion gets a playoff berth regardless of what usually happens to an 0-2 team.
So FanDuel is not simply asking:
How often do 0-2 teams recover?
It is asking:
How often does Houston win this particular division from here?
Different problem.
And the historical 0-2 table does not answer it.
There is another wrinkle.
Houston are part of the recent recovery sample themselves.
They started 0-2 last season.
They still made the playoffs.
The market has seen this roster do exactly what the base rate calls unusual.
And Week 3 tells us something else about how Houston are being rated: they are 2.5-point road favourites at Indianapolis.
An 0-2 team favoured away from home is not being priced like an ordinary 0-2 team.
Narrative noted.
Receipt supplied.
What could break this analysis?
Plenty.
First: sample size.
The headline modern samples are 19 team-seasons and 32 team-seasons.
That is not much.
Second: the 6.25% denominator is derived rather than directly published.
The inputs are sourced. The subtraction is mine.
Third: the population of teams that starts 0-2 may itself be changing.
The NFL moved to a 17-game regular season in 2021.
It is plausible that scheduling, opponent strength or other structural changes affect which teams end up 0-2.
Plausible is not enough.
I do not have evidence strong enough to quantify it, so it stays outside the model.
And finally: Houston’s playoff price has 15 games left to resolve.
That is a lot of football.
An injury, a quarterback change or one divisional upset can move this market far more than another historical percentage point.
The price
So where does that leave Houston at -122?
The historical base rate says somewhere around 11% to 32%.
The market says 55% pre-vig.
That looks like at least a 23-point gap.
I do not think it is an edge.
I think it is evidence that the two numbers are measuring different things.
The base rate measures what happens to 0-2 teams across the league.
Houston’s price depends heavily on whether the AFC South is as weak as it currently looks and whether Houston are the best of four flawed teams.
Two weeks is not enough for me to price that precisely.
So I won’t.
THE LEDGER
Market: Houston Texans to make the 2026 playoffs
Price: -122, FanDuel via FOX Sports
Model probability: No point estimate
Market probability: 55.0% pre-vig
Ledger edge: Not calculable
Fair odds: Not enough information
Confidence: Low
Verdict: PASS
If the price drifts beyond +120, I look again.
If it shortens through -160, I look at the other side.
Same team.
Different bet.
And if you remember one thing from all of this, make it this:
There is no honest answer to “how often do 0-2 teams make the playoffs?” without a date range attached.
Anyone giving you one decimal place without telling you which seasons they counted is selling confidence, not probability.
21+ where applicable — check the legal age in your state. Betting is entertainment. A season-long playoff market is not an investment and is not a way to chase losses. If gambling is causing you or someone you know harm, the National Problem Gambling Helpline is free and confidential: call or text 1-800-MY-RESET (1-800-697-3738), or visit 1800myreset.org. 1-800-GAMBLER also remains active through the Council on Compulsive Gambling of New Jersey, and 1-800-522-4700 remains in service.
Disclosure: Bounty Sports may earn a commission from sportsbooks named on this page. It does not change which numbers we quote or which side we argue.
Bounty Sports
22 Sep 2026
Related

NFL
The NFC North Will Be the NFL’s Best Division – and the Packers Will Be Left Out
Every team in the division can make a credible playoff case. That is exactly why one good team will spend January explaining how nine wins were not enough.
Bounty Sports
12 Aug 2026

NFL
The Chiefs’ Championship Window Is Closing Faster Than Anyone Wants to Admit
Patrick Mahomes gives Kansas City a chance in any season. He can no longer hide how much of the old championship machine has been replaced, weakened or asked to age one more year.
Bounty Sports
11 Aug 2026
NFL
The Bills Have Run Out of Acceptable Excuses
Buffalo changed the coach, upgraded Josh Allen's receiving options and invested in the pass rush. The 2026 season can no longer be framed as another respectable step in a long process.
Bounty Sports
11 Aug 2026
Subscribe
By subscribing you agree to with our
Privacy Policy© 2026 Bounty Sports. All rights reserved.